What is CRI? How colors look under LED, fluorescent and sodium lamps
A red sofa that looked rich in the shop can look brownish at home, and a face can look pale under one ceiling light and fine under another. The lamp is the cause: each one sends out its own mix of wavelengths, and a surface can only reflect what the lamp gives it. The color rendering index (CRI) is the number on the box that tries to sum this up. We computed it for real lamp spectra published by the CIE, the international lighting standards body.
Short answer
- CRI compares a lamp with an ideal light of the same warmth: an ideal filament bulb for warm and neutral lamps, daylight for cool ones. Warmth is the color temperature on the box, in kelvin (K): about 2,700 K is warm, 4,000 K neutral, 5,000 K and up cool.
- A score of 100 means eight standard muted colors look the same under the lamp as under that ideal light. It means "as good as a filament bulb of that warmth", which is not the same as perfect. The lower the score, the further colors move.
- The CRI on the box is the general index, written Ra. It leaves out saturated red, which has its own score, R9. In our calculation a typical warm white LED has Ra 82 but R9 only 13. If the box gives no R9, it does not tell you how that bulb handles reds, and neither can we.
- CRI 80 versus 90: in the pictures below, the warm LED with Ra 82 keeps most everyday colors close and makes strong red duller; under the LED with Ra 96 the two halves of almost every tile are hard to tell apart. Between two warm LEDs of the CIE set, the one with Ra 92 shifts the eight colors about 2.2 times less than the Ra 82 one, and its R9 is 73 instead of 13.
Compare two lamps
Pick any two of the 20 CIE lamp spectra we computed. It opens on the CRI 80 versus 90 question: a typical warm white LED against a warm LED with a red chip. These are typical spectra of each lamp type, not a particular bulb from a shop.
Warm white LED, 2,730 K
Ra 82R9 132,730 K
- 1score 80
- 2score 90
- 3score 97
- 4score 78
- 5score 79
- 6score 88
- 7score 83
- 8score 60
- 9score 13
- 10score 78
- 11score 75
- 12score 71
- 13score 82
- 14score 99
CIE LED-B1, blue-pumped phosphor; top half: an ideal filament of the same warmth.
Warm LED with a red chip
Ra 92R9 732,850 K
- 1score 99
- 2score 94
- 3score 81
- 4score 89
- 5score 95
- 6score 93
- 7score 92
- 8score 92
- 9score 73
- 10score 77
- 11score 89
- 12score 74
- 13score 98
- 14score 86
CIE LED-BH1, phosphor + red LED; top half: an ideal filament of the same warmth.
Each tile is one of the 14 CRI test colors: top half under an ideal light of the same warmth, bottom half under the lamp. The number is that color's own score; red means below 50. Ra is the average of tiles 1–8, R9 is tile 9.
The 14 test colors under four lamps
The CIE method uses 14 painted samples, each with a measured reflectance at every wavelength. In each picture the top half of a tile is the sample under the ideal light of the same warmth and the bottom half is the same sample under the lamp. The number below a tile is that sample's own score: 100 means no change, and scores below 50 are printed in red. Tiles 1 to 8 make up Ra; tile 9 is the saturated red, R9.
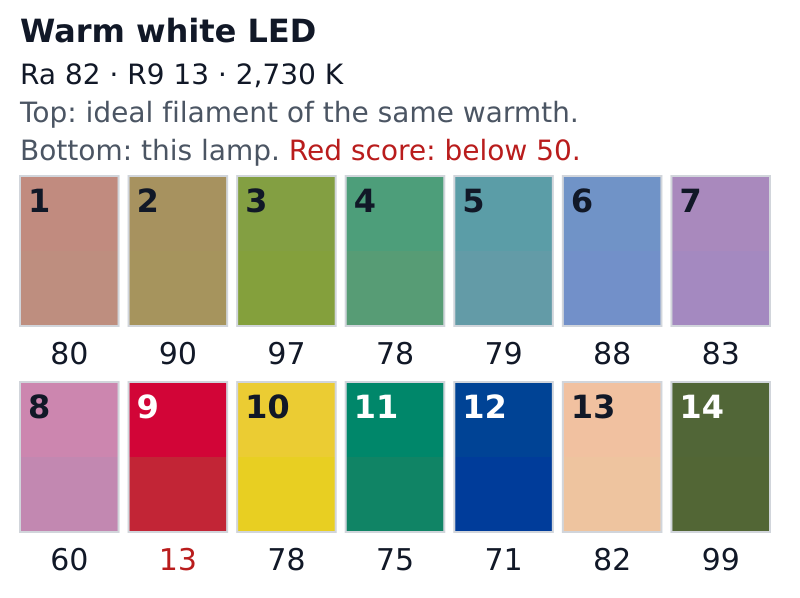
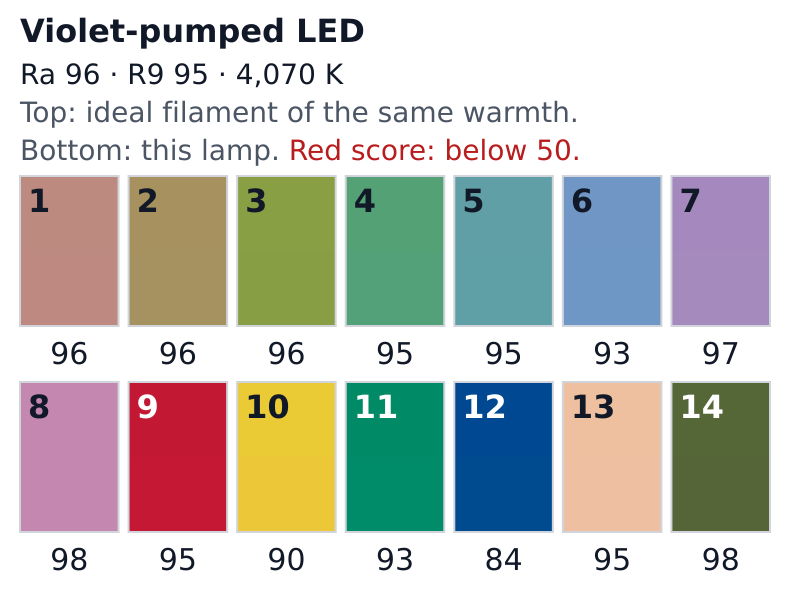
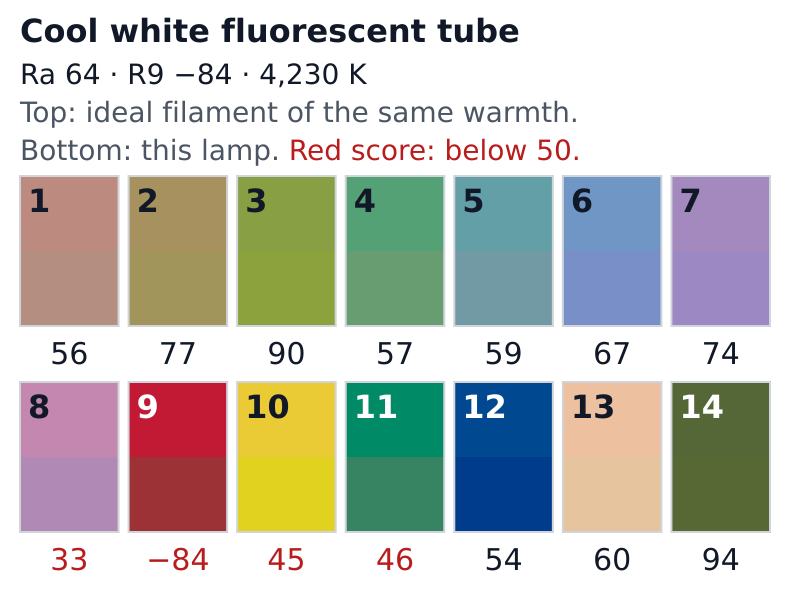
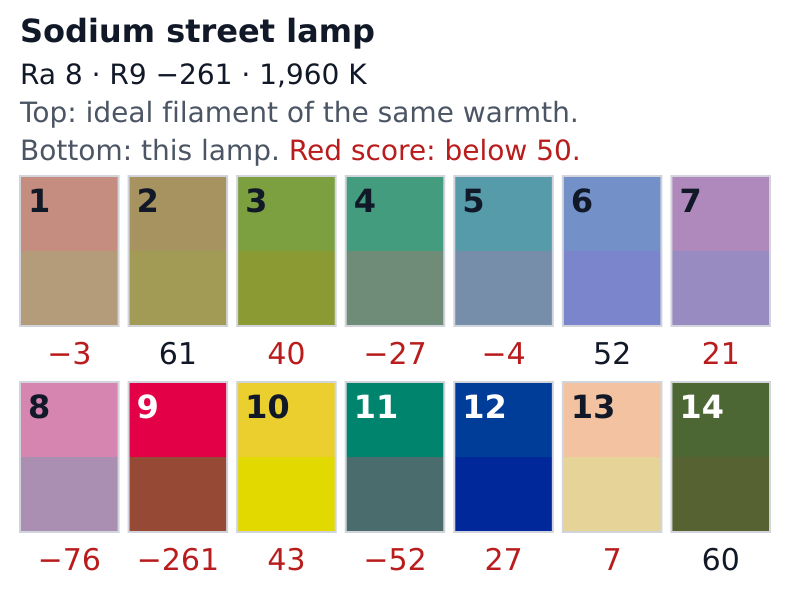
The screen colors are an illustration. Both halves of each tile were converted to screen colors the same way, as if your eye had fully adapted to the lamp's white, and a few saturated samples lie outside what a screen can show, so they are clipped. The scores are computed from the spectra and do not depend on your screen.
Why do colors look different under LED lights?
Daylight and a filament bulb have smooth spectra with some light at every wavelength. The common kind of white LED is a blue chip under a phosphor coating, so its light is a blue spike plus one broad hump. That shape differs most from a filament's at the red end. A surface can only reflect the light that reaches it, and the strong red sample reflects mostly long wavelengths, so it is the most sensitive to how a lamp spreads its red light. Under the warm LED in the CIE set, R9 is 13 while the eight muted samples score between 60 and 97.
The CIE's own LED examples show the two common fixes. Adding a red LED to the mix (LED-BH1) lifts R9 to 73. Pumping the phosphors with a violet chip instead of a blue one (LED-V1 and LED-V2) spreads the light more evenly: R9 98 and 95. An LED made only of red, green and blue chips (LED-RGB1) can look white and still score 57, with R9 at −34. Boxes rarely say how the white light is made, so the Ra and R9 numbers are what you can actually compare in a shop.
The bulb you replaced matters too. Below 5,000 K the CRI reference is the spectrum of an ideal filament, so an old incandescent or halogen bulb scores close to 100 almost by construction. Swap it for the warm LED above and, at the same warmth, the eight test colors move by 4.0 units on average on the CRI's own scale, where the filament moves them by almost none.
Color temperature is a separate effect. A 2,700 K lamp makes everything warmer than a 5,000 K lamp even if both have a perfect CRI, because CRI compares each lamp only with a reference of its own color temperature. You can try that part on a photo of a room with our light color temperature simulator, or see the color of any Kelvin value with Kelvin to RGB. For a paint chip, both effects add up, so the only sure check is to look at it under the bulbs you will use, at the warmth you will use.
Ra and R9 for eight lamps
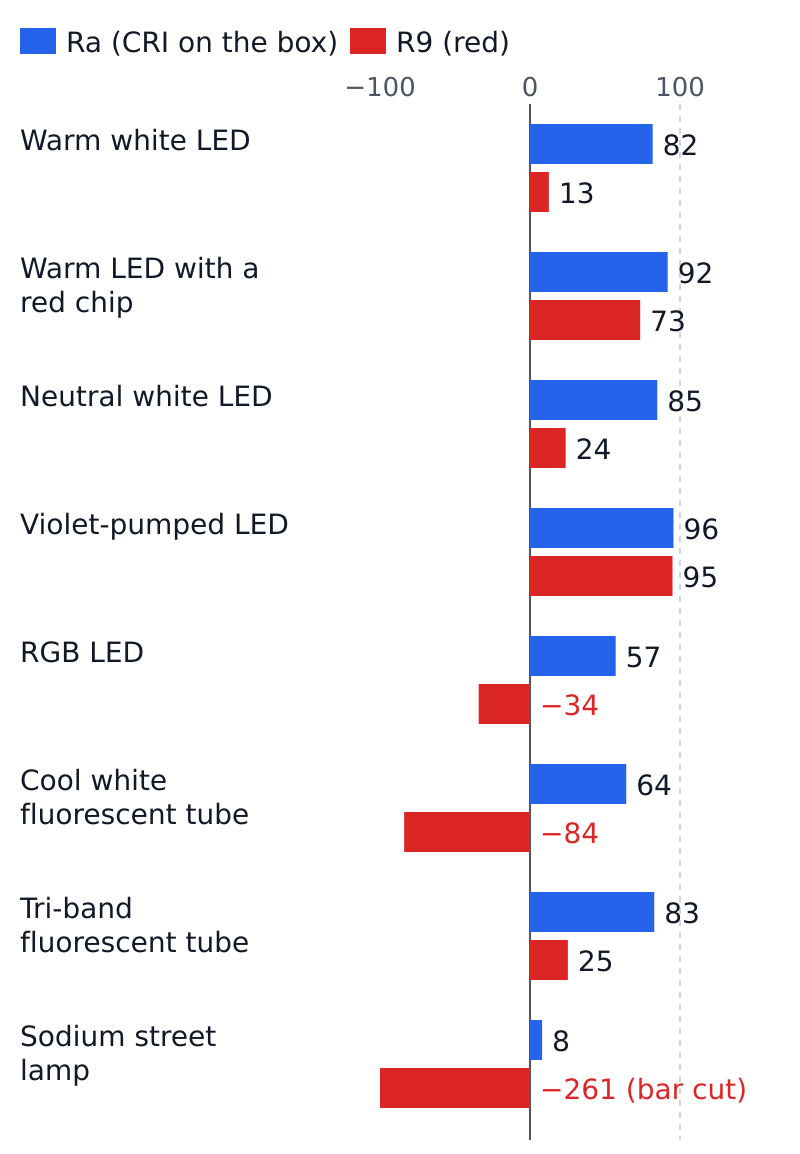
| Lamp (CIE name) | Color temp. | Ra | R9 |
|---|---|---|---|
| Warm white LED (LED-B1) | 2,730 K | 82 | 13 |
| Warm LED with a red chip (LED-BH1) | 2,850 K | 92 | 73 |
| Neutral white LED (LED-B3) | 4,100 K | 85 | 24 |
| Violet-pumped LED (LED-V2) | 4,070 K | 96 | 95 |
| RGB LED (LED-RGB1) | 2,840 K | 57 | −34 |
| Cool white fluorescent tube (FL2) | 4,230 K | 64 | −84 |
| Tri-band fluorescent tube (FL11) | 4,000 K | 83 | 25 |
| Sodium street lamp (HP1) | 1,960 K | 8 | −261 |
These are standard spectra the CIE publishes as typical of each lamp type. A real bulb from a shop has its own spectrum and its own numbers; the box or the data sheet is where to find them.
What CRI does not tell you
- Ra is an average of eight muted colors. A lamp can do well on them and badly on one strong color. The tri-band tube above scores Ra 83 but only 50 on yellow-green and 47 on strong yellow. For art or anything with strong colors, Ra alone is not enough.
- A score says how far a color moves. It does not say in which direction: a lamp that makes reds richer and one that makes them muddy can lose the same points. Under the warm LED above, the direction is mostly toward duller: 12 of the 14 samples lose saturation, by up to 18%.
- The way the score measures color difference dates from 1964 (the CIE U*V*W* space). Critics cited on Wikipedia (Davis and Ohno, 2006) call it obsolete and uneven. The reference also switches from filament to daylight at 5,000 K, so two lamps either side of that line are compared with different references.
- Newer methods exist. The CIE published a color fidelity index in 2017 (CIE 224:2017) that uses 99 test samples, and Wikipedia notes that IES TM-30 has begun replacing CRI among professional lighting designers. We have not computed either here.
- Whether you will notice a given shift in your own room depends on the room and on you. The scores show how far colors move; they cannot tell you how much that will bother you.
How CRI is calculated
The method is set out in CIE 13.3, published in 1995 as a re-publication of the 1974 edition, according to Wikipedia's article on the index. In short:
- Find the lamp's correlated color temperature: the temperature of the glowing black body whose color is closest to the lamp's white.
- Pick a reference light of that temperature: a black body (an ideal filament) below 5,000 K, a CIE daylight spectrum from 5,000 K up.
- Compute the color of each test sample under the lamp and under the reference, and correct the lamp side for the small difference between the two whites (a von Kries adaptation).
- Measure the distance between the two colors of each sample in the CIE 1964 U*V*W* color space. The sample's score is Ri = 100 − 4.6 × that distance.
- Ra is the average of R1 to R8. R9 to R14 are reported separately.
The 14 samples, in order: 1 grayish red, 2 grayish yellow, 3 yellow-green, 4 yellowish green, 5 bluish green, 6 light blue, 7 violet, 8 reddish purple, 9 strong red, 10 strong yellow, 11 strong green, 12 strong blue, 13 light yellowish pink (skin), 14 olive green (leaf). The first eight are fairly muted colors of the same medium lightness (Munsell value 6); 9 to 12 are saturated; Wikipedia describes 13 as light skin and 14 as leaf green.
What this page cannot show
- Only the 14 swatches. Relighting a photo would need the spectrum of every surface in it, and a photo stores three numbers per pixel.
- There is no low-pressure sodium lamp in the CIE open tables, so the sodium example is the CIE's standard high-pressure sodium lamp, HP1.
- The tiles show color as if your eye had fully adapted to each lamp's white. We did not model partial adaptation, which can happen in a real room.
How we computed this
Our script follows the CIE 13.3 method as Wikipedia lays it out, with the U*V*W* formulas from CIE 15:2004: lamp, sample and observer data in 5 nm steps from 380 to 780 nm (the range of the CIE lamp tables), the CIE 1931 2° observer, the correlated color temperature found on the black-body line in the CIE 1960 (u, v) diagram, CIE daylight built from its three published components, the von Kries correction and U*V*W* as above. All spectra are CIE open data tables, copied unchanged (CC BY-SA 4.0). Every lamp on this page is close enough to the black-body line for CRI to apply (the method's limit, as Wikipedia's worked example gives it, is a distance of 0.0054 in the CIE 1960 diagram). We have not read CIE 13.3 itself; the method is confirmed by matching CIE's published results below.
Check against published values: CIE 15:2004 (Colorimetry, 3rd edition, tables T.8 and T.9) lists Ra for the fluorescent lamps FL1 to FL12; our values are within 0.6 of all twelve. For the sodium lamp HP1 it lists all 14 sample scores; ours are within 0.9 of each, including the R9 of −260. Of 32 published Ra values, 28 match within 1; two metal halide lamps and two fluorescent lamps from the same tables miss by 1.4 to 2.1, and we do not show those lamps. For the LED lamps we found no published Ra to compare with; their color temperatures match the CIE values within 1 K. Computed on November 8, 2026.
Sources
- CIE (1995). Spectral radiance factors of 14 test samples for the CIE colour rendering index calculation (data table, from CIE 13.3:1995). doi:10.25039/CIE.DS.wuiuu9cz.
- CIE (2018). Relative spectral power distributions of illuminants representing typical LED lamps (data table, from CIE 015:2018). doi:10.25039/CIE.DS.vgssnyfg.
- CIE (2018). Relative spectral power distributions of illuminants representing typical fluorescent lamps (data table, from CIE 015:2018). doi:10.25039/CIE.DS.ukaymjdn.
- CIE (2018). Relative spectral power distributions of high pressure discharge lamp illuminants (data table, from CIE 015:2018). doi:10.25039/CIE.DS.f6rvvnev.
- CIE. Components of the relative spectral distribution of daylight (data table, from CIE 015:2018). doi:10.25039/CIE.DS.w7zunnny.
- CIE. Colour-matching functions of the CIE 1931 standard colorimetric observer (data table). doi:10.25039/CIE.DS.xvudnb9b.
- CIE 13.3:1995. Method of measuring and specifying colour rendering properties of light sources. doi:10.25039/tr.013.3.1995 (not read; the steps follow Wikipedia's description and are checked against CIE 15:2004's published results).
- CIE 15:2004. Colorimetry, 3rd edition, tables T.8.1, T.8.2 and T.9 (copy on archive.org).
- Color rendering index, Wikipedia (history, method, sample names, criticism, TM-30).