The Purkinje effect: why reds go dark at dusk and blues stay bright
Watch a garden as the sun goes down. Red flowers turn dark gray and then black, while blue flowers and green leaves stay visible for a long time. The flowers have not changed. Your eye has switched to a different set of cells. This guide computes what that switch does to seven common colors, shows the two sensitivity curves behind it, and explains why red light is the usual choice for keeping your night vision.
Short answer
- Your eye has two kinds of light-sensitive cell. Cones work in daylight and see color. Rods work in dim light. Cones respond best to yellow-green light, rods to blue-green light, and rods hardly respond to deep red at all.
- So as light fades, reds lose brightness faster than blues. In our calculation a pure red surface is about 3 times as bright as a pure blue one by day; at night the blue is 22 times as bright as the red.
- Colors fade at night because all rods are of one kind. A rod tells the brain only how much light it caught; the color of that light is lost.
- Because rods barely respond to deep red light, a dim red lamp lets you read a map in the dark with less harm to your night vision than a white one.
Key numbers
- The human eye is most sensitive at 555 nm in daylight (cones) and at about 507 nm at night (rods), according to the CIE day and night luminous efficiency curves.
- In our model calculation from the CIE curves, a pure red surface is about 3 times as bright as a pure blue one by day; at night the blue is 22 times as bright as the red.
- Among 7.9 million pairs of screen colors that differ by at least 1% of white in both day and night vision, 16% swap which one looks lighter (our calculation on an even grid of 4,096 colors).
- In a count of eight human retinas, the average was about 92 million rods and 4.6 million cones per eye (Curcio and colleagues, 1990).
- In the dark, rods overtake cones after 5 to 8 minutes, and the eye reaches full sensitivity after about 40 minutes (Webvision, Kalloniatis and Luu).
What you see at dusk
The effect is named after the Czech physiologist Jan Evangelista Purkyně (Purkinje in German spelling), who described it in an 1825 book on vision; it is also called the Purkinje shift. In the words of a review by Andrew Zele and Dingcai Cao: as the rods take over in the dark, the eye's peak sensitivity moves toward shorter wavelengths. Objects that reflect mostly green and blue light then look brighter than objects that reflect mostly red and orange light.
You can see it on any evening walk. A red car, a red rose or a red sign turns into a dark shape first. Blue paint, green grass and blue-green signs keep their brightness longer, though they too lose their color.
What it does to colors
We took seven colors and white, gave each one a realistic reflectance spectrum (how much light it reflects at each wavelength), lit it with standard daylight and measured its brightness with the day and the night curve of the eye. Every number is relative to a white sheet under the same light, which is how the eye judges brightness in a scene. The middle column is twilight, halfway between the two curves. The method is under How we computed this.
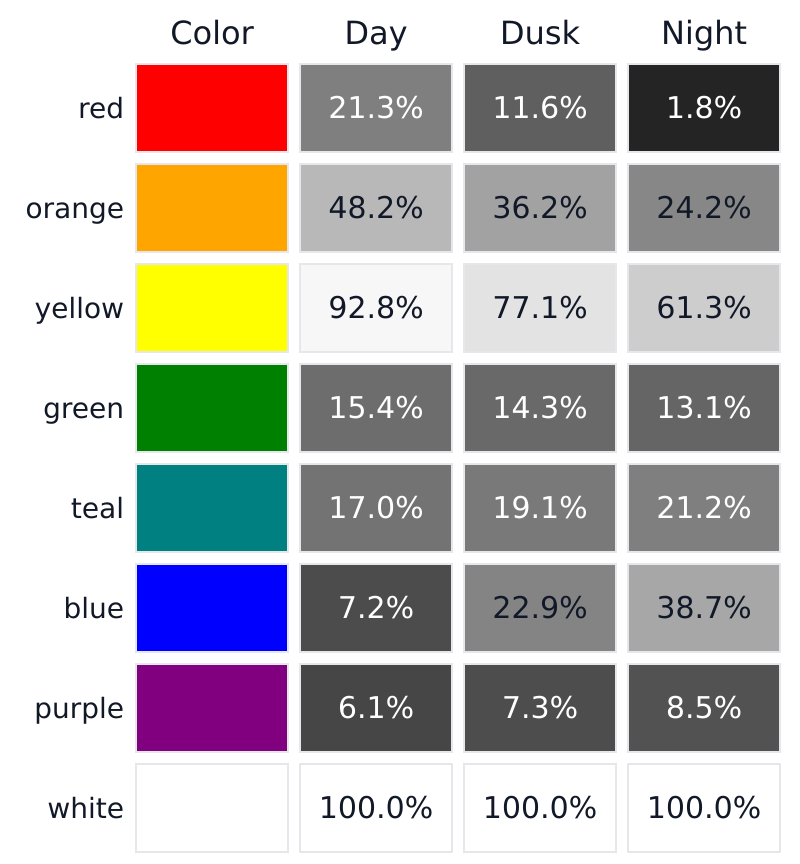
By day, the red is about 3 times as bright as the blue. At night the order flips: the blue is 22 times as bright as the red. Teal and purple get somewhat lighter. Orange loses half of its brightness relative to white and yellow about a third; green changes little.
We also checked how often the order of two colors flips. For that, 4,096 RGB colors spread evenly over the screen's range went into one set, and we compared every pair that differs by at least 1% of white in both the day and the night version. Of 7.9 million such pairs, 16% swap places: the color that is lighter by day is darker at night.
Two kinds of cell, two curves
Cones come in three types, which together give color vision. Rods are far more sensitive and take over in dim light, but they come in only one type. In a count of eight human retinas, Curcio and colleagues (1990) found on average 92 million rods and 4.6 million cones per eye. Vision by cones in daylight is called photopic, vision by rods in the dark scotopic, and the twilight range where both work mesopic.
The International Commission on Illumination (CIE) publishes two standard curves, called luminous efficiency functions, that describe how sensitive the average eye is to each wavelength: the photopic day curve V(λ) and the scotopic night curve V′(λ). Wavelength is measured in nanometers (nm): about 450 nm looks blue, 550 nm yellow-green, 650 nm red. Each curve is scaled so that its peak is 1.
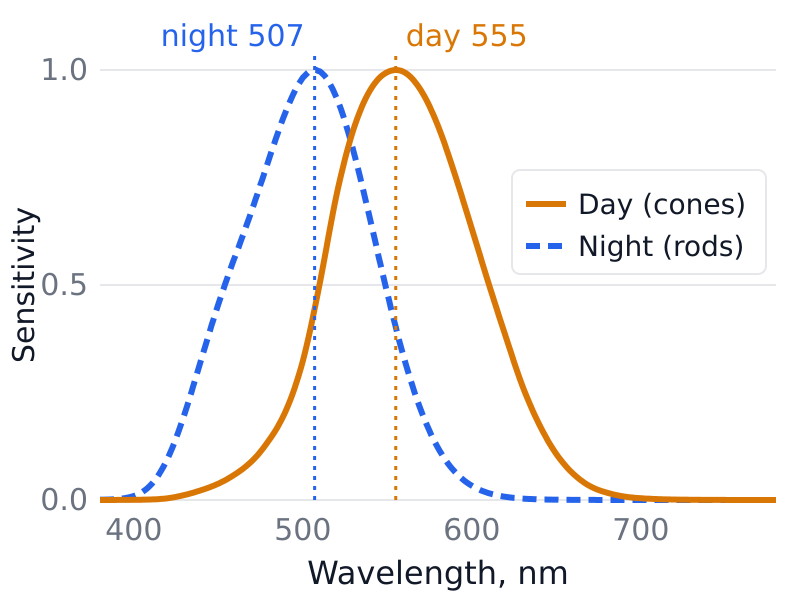
The day curve peaks at 555 nm. The night curve reads 1.000 from 506 to 508 nm, so its peak is usually given as 507 nm. The two scaled curves cross at about 528 nm: to the left of that point the night curve is higher, to the right the day curve. The crossing only compares the shapes of the curves, since each is scaled to its own peak. In absolute terms dark-adapted rods are far more sensitive: Zele and Cao put them a factor of 1,000 or more above the cones at middle and short wavelengths. The difference in shape grows fast toward the ends of the spectrum:
- At 450 nm (blue) the night curve is at 45.5% of its peak and the day curve at 3.8%.
- At 600 nm (orange) the night curve is at 3.3%, the day curve at 63.1%.
- At 650 nm (red) the night curve is at 0.068%, the day curve at 10.7%.
The pigment inside the rods, rhodopsin, peaks a little lower than the curve. Bowmaker and Dartnall (1980) measured single rods from a human retina and found an average peak of 497.6 nm. The CIE curve describes the whole eye, and light passes through the lens and other tissue before it reaches the rods; Bowmaker and Dartnall had to allow for that absorption to compare their rods with the standard curve, and even then the curve they derived came out considerably broader than the CIE one.
Why can't we see color at night?
Color vision works by comparing cell types. A yellow light and a green light excite the three cone types in different proportions, and the brain reads the proportions. Rods come in one type, so each rod gives one number: how much light it caught. A dim blue-green light and a brighter orange light can give the same number, and the rod cannot tell which it was. With rods alone, a scene comes out in shades of gray.
The real picture is less tidy. Zele and Cao describe how, in twilight, both the quality and the range of colors you can see shrink, and they note that some color perception remains possible even in very dim light, through ways of processing rod signals that differ from daylight color vision. The fade to gray is gradual.
How long it takes your eyes to adjust
Step from a lit room into the dark and your sensitivity rises in two stages. According to Webvision, a textbook by Michael Kalloniatis and Charles Luu, the cones adapt first; after 5 to 8 minutes the rods become more sensitive than the cones (the rod–cone break), and the eye reaches its full sensitivity after about forty minutes in the dark.
Why red light keeps your night vision
The curves above explain a practical trick. At most wavelengths dark-adapted rods are far more sensitive than cones, but in deep red they lose that advantage: Zele and Cao write that above 650 nm rods and cones have about the same threshold in the dark, and Webvision notes that with deep red test light there is no rod–cone break at all. So a deep red light that is bright enough for your cones to read by gives the rods much less light, relative to what they need, than a white or blue light of the same visible brightness. That is why dim red lamps are used in aircraft cockpits, submarine control rooms and by amateur astronomers, as Wikipedia's article on the effect lists. The curves point to the deepest red you can find, kept as dim as you can still work by.
Why faint stars vanish when you look straight at them
The very center of your vision, in the middle of the fovea, has no rods at all. Curcio and colleagues measured this rod-free zone at about 0.35 mm across, which is about 1.25° of your field of view. In very dim light the spot you look at directly is the least sensitive part of your vision, so a faint star or a faint light can be easier to see just to the side of where you are looking. Astronomers call this averted vision.
Dogs: the same split between rods and cones
This guide is about human eyes; how well dogs see in the dark is a separate question it does not cover. Dogs do have the same split. Jacobs and colleagues (1993) measured two cone pigments in dogs, near 555 and 430–435 nm, and put the peak of the dog rod pigment at about 508 nm, close to ours. Our dog vision and cat vision pages show how their daylight color vision differs from ours.
What this model cannot show
- The reflectance spectra are synthetic. Real red paint, a rose petal and a red LED each have their own spectrum, and their night numbers will differ from ours. The direction of the change (red darker, blue lighter) should hold for any surface that reflects mostly long or mostly short wavelengths, because that is where the two curves differ most.
- The grays show brightness only. They do not show how much color is left at dusk or how colors shift in hue.
- The CIE curves describe a standard observer. Individual eyes differ, so your own dusk will not match the numbers exactly.
- A photo or a screen cannot put you in the dark. To see the real effect, look at a red and a blue object outdoors at dusk.
To look up the wavelength behind a screen color, try our color to wavelength tool, or go the other way with wavelength to color.
How we computed this
A screen color has no spectrum, so for each RGB color we used the reflectance spectrum that our paint mixer builds for it with the open spectral.js library. These spectra are synthetic: they reproduce the RGB color in daylight, but they are not measurements of real paint or petals.
Twilight: the CIE describes the mesopic range with a blend of the two curves, m·V + (1 − m)·V′, where the weight m goes from 1 (day curve only, at 5 candela per square meter or more) to 0 (night curve only, at 0.005 cd/m² or less), as Gao and colleagues (2017) set out from the CIE system called MES2. The dusk column uses m = 0.5, which in that system corresponds to about 0.16 cd/m². MES2 is a system for measuring light at twilight levels, with street and road lighting as a main use; it predicts brightness only, so treat the dusk column as an illustration.
Day curve: the CIE 1931 ȳ function from our own color code, which equals the CIE photopic V(λ) table to within 0.0000005. Night curve: the CIE scotopic V′(λ) table, 380 to 780 nm in 1 nm steps, copied unchanged (CC BY-SA 4.0). Surfaces: spectral.js reflectance spectra for each sRGB color, 380 to 750 nm in 10 nm steps, under CIE illuminant D65; for every color the day value matches the standard sRGB luminance to within 0.004% of white. Swap count: a grid of 16 levels per channel, pairs where both differences are at least 0.01. Computed on November 8, 2026 with our own script.
Sources
- CIE (2019). CIE spectral luminous efficiency for scotopic vision (data table, from CIE 018:2019). doi:10.25039/CIE.DS.gr6w4b5g.
- CIE (2019). CIE spectral luminous efficiency for photopic vision (data table). doi:10.25039/CIE.DS.dktna2s3.
- Zele A. J., Cao D. (2015; volume dated 2014). Vision under mesopic and scotopic illumination. Frontiers in Psychology 5:1594. doi:10.3389/fpsyg.2014.01594 (full text).
- Bowmaker J. K., Dartnall H. J. A. (1980). Visual pigments of rods and cones in a human retina. Journal of Physiology 298:501–511. doi:10.1113/jphysiol.1980.sp013097 (abstract read).
- Curcio C. A., Sloan K. R., Kalina R. E., Hendrickson A. E. (1990). Human photoreceptor topography. Journal of Comparative Neurology 292:497–523. doi:10.1002/cne.902920402 (abstract read).
- Kalloniatis M., Luu C. Light and dark adaptation. Webvision.
- Gao C. et al. (2017). Improved computation of the adaptation coefficient in the CIE system of mesopic photometry. Optics Express 25:18365. doi:10.1364/OE.25.018365.
- Jacobs G. H., Deegan J. F., Crognale M. A., Fenwick J. A. (1993). Photopigments of dogs and foxes and their implications for canid vision. Visual Neuroscience 10:173–180. doi:10.1017/s0952523800003291 (abstract read).
- Purkinje J. (1825). Beobachtungen und Versuche zur Physiologie der Sinne. Neue Beiträge zur Kenntniss des Sehens in subjectiver Hinsicht. Berlin: Reimer (cited from Zele and Cao; not read).